


2017: Year In Review
- Jan 1, 2018
- 1 min read
2017 is a wrap. In this blog post, we bring you the statistics of how the year compared with 2016 and the average of all years for temperature, precipitation, and snowfall.
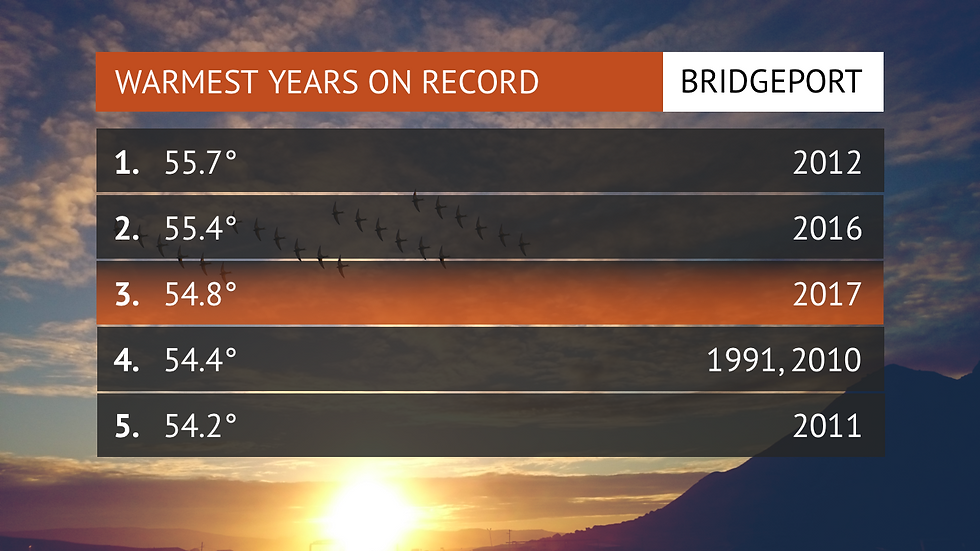
In terms of temperature, I don't want to get into the climate change debate but based on the list below for warmest years on record, most have been in recent times during this century. 2017 ranked at the third spot for warmest year on record while 2016 and 2012 rank at the second and first spots, respectively. Also notice how 2010 and 2011 also made the list for top five warmest years.
The average temperature takes into consideration the average temperature for each day of the year. Below, you'll see that this year's average temperature was 54.7 degrees. That is cooler than in 2016 but warmer than the average.

In terms of precipitation, which includes both rain and snow, we were about an inch and a half below average. At least we received more precipitation than in 2016, which is when we dealt with a drought, significant at times, during the year.

The last statistics we have for you is how snowfall compared to the past. Snowfall in 2017 was 16.2 inches above average. Now that is significant. On average, we receive 27.4 inches.

The reason for the above normal snowfall in 2017 was due to two significant snowstorms: one in February and one in March. Based on the graph below, you can see those two quick jumps in the snowfall for the year compared to average.

Comments